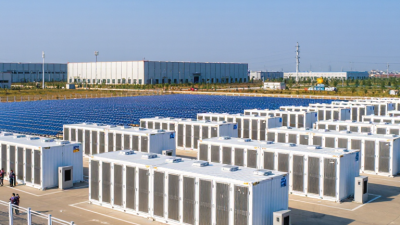
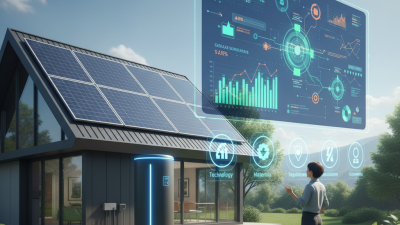
2026 Best Solar Battery Storage System Suppliers?

Choosing the 2026 best Solar Battery Storage System supplier requires more than comparing price tags. A glossy specification sheet cannot reveal how a battery performs during winter outages, repeated evening cycling, or a summer heatwave. Buyers need evidence from tested installations, transparent warranties, and responsive technical support.

Dr. Imre Gyuk, a recognized energy-storage authority, has stated, “Energy storage is the key to enabling the grid of the future.” His view reflects a practical reality. Solar panels produce power when sunlight is available. Batteries must bridge the darker hours safely and consistently. The strongest suppliers therefore combine reliable cells, intelligent energy management, thermal protection, and clear performance data.

This guide examines leading suppliers through usable capacity, round-trip efficiency, cycle life, degradation guarantees, certification, monitoring software, and after-sales service. It also considers installer quality and replacement procedures. Small details matter. A homeowner may need a quiet cabinet beside the garage, while a business may require three-phase backup and rapid recovery after grid failure. Some suppliers look excellent on paper. Their local support can still disappoint. That possibility deserves honest attention.

No single brand suits every project. Budget, climate, electricity rates, backup expectations, and roof generation all change the decision. The best Solar Battery Storage System is not necessarily the largest one. It is the system that delivers dependable value under real operating conditions. Performance claims should be checked carefully. Even this comparison cannot remove every uncertainty.
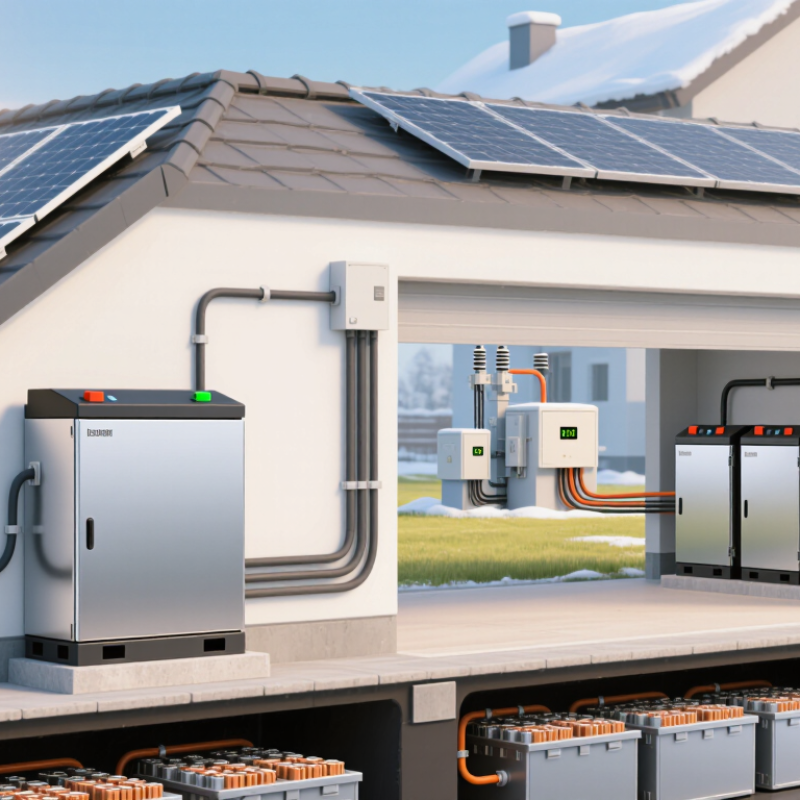
2026 Best Solar Battery Storage System Suppliers?

2026 Market Baseline: Global Battery Storage Growth Reported by the IEA

The 2026 battery storage market begins with an urgent baseline. The International Energy Agency reported nearly 42 GW of new battery storage capacity in 2023. That figure represented more than 90% annual growth. The IEA also estimates that global energy storage must expand sixfold by 2030, reaching about 1,500 GW, to support renewable power targets. These numbers change how buyers should judge suppliers.

A capable supplier should provide more than attractive battery prices. Buyers need verified cycle-life data, thermal safety testing, warranty conditions, and local service capacity. The IEA’s Batteries and Secure Energy Transitions report highlights supply-chain concentration as a continuing risk.

A delayed component can leave a containerized system idle beside a solar farm. That practical detail matters more than a polished brochure.

Cost remains important, but it is not the only measure of value. Lazard’s 2024 Levelized Cost of Storage analysis shows that storage economics vary widely by project design, duration, and operating profile.

A four-hour system may suit evening demand, while a shorter system may support rapid grid balancing. Some supplier claims still rely on ideal laboratory conditions. Buyers should request independently tested results, degradation assumptions, and clear recycling plans.

The market is growing quickly, but procurement standards have not matured equally everywhere.

Battery Technologies Compared: LFP, NMC, Efficiency, and Cycle-Life Data

2026 Best Solar Battery Storage System Suppliers?

Choosing a solar battery supplier requires more than comparing advertised capacity. Ask for chemistry, usable energy, round-trip efficiency, cycle testing, and warranty conditions. These details reveal how the system may perform after years of daily charging.

LFP batteries generally offer stronger thermal stability and longer cycle life. Many systems report 4,000 to 8,000 cycles at moderate depth of discharge. NMC batteries usually provide higher energy density, which can reduce cabinet size. However, their useful life may be shorter under high heat and frequent deep cycling. Round-trip efficiency often falls between 90% and 97%, but installation quality, inverter settings, and standby losses affect real results. A 95% figure can mislead. Real homes rarely match laboratory charts.

Tips: Request independent test reports, not only supplier brochures. Check whether cycle figures use 80% or 100% depth of discharge. Review warranty limits for temperature, annual throughput, and remaining capacity. Measure evening loads before choosing capacity. Oversizing wastes money, while undersizing can increase grid dependence. I would also inspect service response times and replacement procedures. These practical details matter when the battery stops working during a winter outage. Performance estimates remain imperfect, especially when local weather and household habits change.

2026 Best Solar Battery Storage System Suppliers? – Battery Technologies Compared: LFP, NMC, Efficiency, and Cycle-Life Data

Battery Technology Typical Solar Storage Use Cell Energy Density
(Wh/kg)
Recommended
Usable DoD
Typical Round-Trip
Efficiency
Cycle Life to 80% SOH Typical Continuous
Charge/Discharge Rate
Thermal Safety Profile Best Selection Priority
Lithium Iron Phosphate (LFP) Residential, commercial, and utility-scale daily solar shifting 90–160 80–95% 90–97% DC-to-DC
85–95% AC-to-AC
3,000–8,000 cycles 0.5C–1C Low risk among mainstream lithium-ion chemistries; non-flammable electrolyte remains possible, so certified enclosure and thermal monitoring are required. Long service life, safety, frequent cycling, and predictable lifetime cost
Nickel Manganese Cobalt (NMC) Space-constrained residential and mobile or hybrid applications 150–250 80–90% 90–97% DC-to-DC
85–95% AC-to-AC
1,000–3,000 cycles 0.5C–1C Higher thermal-management requirements than LFP; robust battery-management and fire-protection systems are important. Maximum energy in limited installation space and lower pack weight
Lithium Titanate (LTO) High-power, rapid-cycling, and cold-weather installations 50–90 80–95% 90–97% DC-to-DC
85–95% AC-to-AC
10,000–20,000 cycles 1C–5C, depending on design Very high thermal and cycle stability; typically requires more installation space and has a higher upfront cost. Extreme cycle frequency, high power, and extended operating life
Valve-Regulated Lead-Acid (VRLA) Backup power and low-cycle solar systems with limited budgets 30–50 50–80% 75–85% DC-to-DC
70–85% AC-to-AC
500–1,500 cycles 0.1C–0.3C Lower energy density and ventilation requirements; deep discharge and high temperatures can significantly reduce life. Low initial cost, occasional backup, and simple replacement logistics
Flow Battery Long-duration commercial and utility-scale energy storage 10–40 70–100% 65–85% DC-to-DC
60–80% AC-to-AC
10,000–20,000+ cycles 0.1C–0.5C Low fire-propagation risk in many aqueous designs; pumps, tanks, and electrolyte management add system complexity. Four-to-twelve-hour storage duration and frequent deep cycling
Efficiency Definition
DC-to-DC efficiency reflects battery and power-conversion losses. AC-to-AC efficiency also includes inverter, transformer, standby, and control-system losses.
Cycle-Life Conditions
Ranges generally assume controlled temperature, approximately 0.5C operation, and a defined end point of 80% remaining capacity. Actual results vary by operating profile.
Supplier Evaluation Checklist
Compare usable kWh, warranty throughput, temperature limits, safety certifications, ingress protection, backup capability, service support, and replacement terms—not only nameplate capacity.

Note: Performance values are representative technology ranges rather than guarantees for any specific product. System-level results depend on cell design, battery-management software, inverter topology, ambient temperature, installation, and operating strategy.

Supplier Selection Criteria: IEC Safety Standards, Warranties, and Bankability

Choosing a solar battery supplier in 2026 requires more than comparing price per kilowatt-hour. The IEA reported that global battery storage additions nearly doubled in 2023, reaching about 42 GW. Rapid growth increases supplier choice, but it also increases quality risks. Ask for IEC 62619 and IEC 63056 evidence for battery safety. IEC 62477-1 is also relevant for power-conversion equipment. Certificates should identify the tested model, factory, and certification scope. A logo alone proves little.

Warranty language deserves close inspection. Check capacity retention, cycle limits, annual throughput, operating temperature, and response procedures. A ten-year warranty may cover only limited energy throughput. BloombergNEF reported average lithium-ion battery pack prices at about 115 dollars per kWh in 2024, after a 20% annual decline. Lower prices are useful, but aggressive cost cutting can affect testing, spare parts, and service quality. That connection is easy to overlook.

Tips: Request an independent test report, audited financial information, and three comparable project references. Review the supplier’s degradation model against your climate and daily cycling pattern. Ask who pays for replacement labor and transport. Confirm whether remote monitoring data remains accessible if the supplier fails. No checklist is perfect. I would also challenge optimistic guarantees; real sites age unevenly, especially under heat, dust, and frequent cycling. Bankability means the supplier can still support the system years after installation, not merely deliver it today.

2026 Supplier Landscape: Capacity, Geography, and BloombergNEF Tier Rankings

In 2026, solar battery supplier selection depends on capacity, geography, and bankability. The International Energy Agency reported that global battery storage additions reached about 42 GW in 2023, nearly double the previous year. Its Net Zero scenario requires storage deployment to expand sharply before 2030. Scale matters.

Manufacturing remains concentrated in Asia, especially China, while demand is growing across North America, Europe, Australia, and emerging power markets. Suppliers with factories near project regions can reduce shipping delays and simplify spare-parts support. BloombergNEF’s 2025 Energy Storage Tier 1 list offers a useful market signal. However, Tier 1 status reflects manufacturing scale, project delivery, and market activity. It is not a guarantee of lifetime reliability or financial strength.

Capacity figures need careful reading. Some suppliers report annual cell output, while others report complete system shipments or planned factories. These measurements are not interchangeable. The International Renewable Energy Agency also highlights falling storage costs and the growing role of batteries in integrating variable renewable power. Still, public data can lag behind factory changes. A supplier may appear strong on paper while local service coverage remains thin. Buyers should examine warranty reserves, tested cycle life, fire-safety documentation, grid-code compliance, and delivered projects in similar climates. Desert heat exposes weaknesses quickly. Coastal humidity does too. Tier rankings help narrow the field, but independent technical review remains necessary.

System Economics: NREL Metrics for Sizing, Payback, and Round-Trip Efficiency

In 2026, the best solar battery supplier is not simply the lowest-cost seller. It should provide transparent assumptions for capacity, degradation, warranty limits, and dispatch controls. NREL’s REopt platform evaluates storage using hourly load, solar production, tariffs, demand charges, and outage preferences. That approach is more credible than relying on annual energy estimates alone.

NREL’s residential battery model commonly uses about 85% AC round-trip efficiency. A 10 kWh battery may therefore deliver roughly 8.5 kWh after charging losses. Small details matter. A shaded roof changes the result. So does a winter evening load. Payback should include replacement risk, usable capacity, and annual degradation. Many simple calculators overlook these costs.

Lazard’s 2024 Levelized Cost of Storage analysis shows that project economics vary widely by application, duration, and financing structure. NREL’s Annual Technology Baseline also indicates continuing cost reductions, but future savings are not guaranteed. A supplier promising a fast payback deserves careful testing. Request an hourly simulation, not a polished headline. Check whether efficiency is measured at the cell, inverter, or system level. That distinction can quietly change the economics. Supplier comparisons remain imperfect without local tariffs, real load data, and conservative degradation assumptions.

2026 Solar Battery Storage System Economics

NREL-aligned screening metrics for sizing, round-trip efficiency, and simple payback across 2-, 4-, and 8-hour battery configurations.

The comparison assumes a 10 MW system, 365 equivalent full cycles per year, lithium-ion technology, and usable energy equal to rated power multiplied by storage duration. Round-trip efficiency values are representative planning assumptions of 86%, 85%, and 84%. Payback is a modeled simple-payback estimate using scenario-specific installed costs, operating value, and charging costs; it is not a supplier quotation or a universal market result.