How to Compare Solar Panels and Battery Costs in 2026
In 2026, comparing solar quotes means looking beyond the headline price. A rooftop system might include panels, an inverter, installation, and monitoring. A battery adds storage, but its price depends on capacity, usable energy, warranty, and installation work. Small details matter. A garage wall may need electrical upgrades, while a shaded roof can affect expected production.
The phrase Solar Panels And Battery Cost covers more than equipment prices. Compare complete, itemized quotes and check what each one includes. Look for system size, battery capacity, estimated annual output, warranty terms, and any stated assumptions. Ask whether the price includes permits, electrical work, and connection fees. Incentives and utility rates can also change the financial picture, and their availability varies by location. A low quote is not automatically the best value.
This guide explains how to compare solar panels and batteries on a like-for-like basis. It also considers upfront cost, potential bill savings, backup needs, and battery replacement over time. Estimates are useful, not guarantees. Actual results depend on weather, household energy use, equipment, and local rules. Some comparisons still feel imperfect; no single payback figure captures every homeowner’s priorities. A careful review of the numbers—and a few direct questions to installers—can make the differences clearer.
Understanding the Costs of Solar Panels and Batteries in 2026
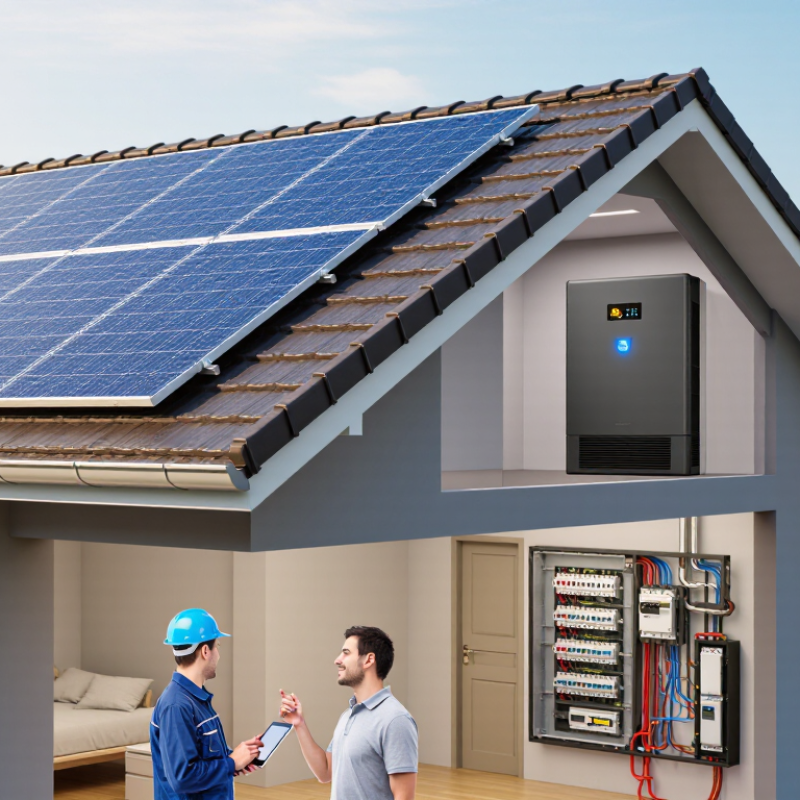
In 2026, solar costs depend on more than the panels on a roof. A quote may include panels, an inverter, mounting hardware, electrical work, permits, and installation. Ask for the system size in kilowatts and the installed price per watt. Then compare what each quote actually includes. A lower price may leave out needed electrical upgrades.
Battery pricing needs a different measure. Compare usable capacity, usually listed in kilowatt-hours, rather than the battery’s headline capacity alone. Check whether the quote includes installation, controls, and any required wiring. A battery can add substantial cost, especially when a home needs several hours of backup. That detail matters. Also ask how much energy remains available during an outage, since some systems reserve capacity for normal operation.
Local labor rates, roof condition, utility rules, and available incentives can shift the final price. Get itemized estimates based on the same panel capacity and battery size. Look closely at warranty terms and expected performance over time, not just the upfront total. Price-per-watt and price-per-kilowatt-hour comparisons help, but they are imperfect: equipment, backup features, and installation scope differ. I would not treat one estimate as a dependable market average. A shaded roof or an older electrical panel can change the calculation quickly.
Comparing Solar Panel Prices, Capacity, and Efficiency
In 2026, compare solar panel prices on the same basis: equipment, installation, and any included battery. A low quote may cover panels only, while another includes wiring, permits, and monitoring. Ask for the panel capacity in kilowatts and the estimated annual output, not just the system’s total price. Capacity indicates how much power the system can produce under standard conditions; it does not guarantee your home will receive that amount. Roof direction, shade, and local weather all affect real-world generation.
Efficiency describes how much sunlight a panel converts into electricity. Higher efficiency can be useful on a small roof, but it may not justify a higher price when space is plentiful. Check the panel’s rated output, efficiency, and product warranty, then compare the cost per installed kilowatt. No spreadsheet captures every roof.
Battery costs should be listed separately, since storage adds expense but can shift solar energy to evening use. Compare usable battery capacity, measured in kilowatt-hours, rather than headline capacity alone.
A common mistake is treating a larger system as automatically better; your household’s daytime use and utility rates matter too. Estimates are imperfect, and even careful comparisons can miss future changes in energy use.
Comparing Battery Prices, Capacity, and Usable Storage
Battery quotes are easy to misread. A 10 kWh rating describes nominal capacity, not necessarily the energy available to your home. Check the usable-capacity figure and any reserve setting. If a 10 kWh unit allows 90% depth of discharge, about 9 kWh is available before conversion losses. That may cover a refrigerator, lights, and internet overnight, but not necessarily electric heating.
EnergySage’s H2 2024 Solar and Storage Marketplace Report found an average quoted battery price of $1,133 per kWh. Treat that as a market snapshot, not a guaranteed 2026 price: installation scope, location, and system size can shift the quote. Compare total installed cost against usable kWh, rather than dividing by the larger nameplate figure. Also check continuous power output; capacity tells you how long a battery can run loads, while power tells you how many loads it can run at once.
Efficiency matters, too. NREL’s 2024 Annual Technology Baseline uses 85% round-trip efficiency as a utility-scale battery modeling assumption; household products may differ. Ask for the specification sheet and warranty terms. A low price can look less attractive if usable storage is modest or warranty coverage excludes expected cycling. The comparison is a little messy. That is normal. For a fair estimate, list your evening usage, backup reserve, and the circuits you actually want powered.
Evaluating Installation Costs, Incentives, and System Quotes
How to Compare Solar Panels and Battery Costs in 2026
A useful comparison starts with the same system size, battery capacity, and roof assumptions on every quote. Lawrence Berkeley National Laboratory’s 2024 Tracking the Sun report put the median residential solar price near $3.1 per watt for systems installed in 2023, before incentives. Treat that as a benchmark, not a 2026 price promise. Labor, electrical upgrades, roof work, and local permitting can move a quote substantially. Ask contractors to itemize each cost.
For batteries, compare usable kilowatt-hours, power output, included equipment, and warranty terms—not just the headline price. NREL’s 2024 Annual Technology Baseline shows that storage costs vary with system duration and configuration, making simple price-per-kWh comparisons incomplete. Check whether the quote includes a hybrid inverter, backup circuits, and installation. A battery sized for evening use may not keep an entire home running during an outage. Incentives can also depend on location, project details, and the rules in effect when you install. Verify eligibility with current official guidance; do not subtract an incentive before confirming it.
Tips
Put each quote in a one-page table. Compare total installed cost, cost per watt, usable battery capacity, and incentive assumptions. Ask what happens if a panel upgrade or roof repair is needed. Small exclusions matter. One estimate may look cheaper because it leaves out work your home still needs.
Calculating Long-Term Value Across Solar and Battery Options
Comparing solar and batteries in 2026 means looking beyond the invoice. EnergySage’s H1 2024 Solar and Storage Marketplace Report put median quoted solar pricing at $2.69 per watt and battery pricing at $1,133 per kilowatt-hour. Lawrence Berkeley National Laboratory’s Tracking the Sun 2024 report found a $3.15-per-watt median installed price for residential solar in 2023. These figures come from different datasets and periods, so they are useful reference points, not direct price guarantees. That gap matters.
Estimate value over the same time horizon. Add expected bill savings, applicable incentives, and any value from backup power; subtract installation, financing, maintenance, and likely replacement costs. A 10-kilowatt-hour battery at the marketplace median implies roughly $11,330 before other costs. But its value depends on what it actually powers: evening appliances, a refrigerator during an outage, or little more than stored energy left unused. Check local export rates and hourly electricity prices. They can change the result sharply.
Use a realistic solar production estimate, not the best month on the roof. NREL’s PVWatts calculator can model production using location, system size, and roof orientation. Battery efficiency losses and capacity fade also deserve a place in the spreadsheet. The uncomfortable part: future utility rates are uncertain, and a precise payback year can create false confidence. Compare several rate and replacement scenarios, then check whether the battery’s extra cost still makes sense.
How to Compare Solar Panels and Battery Costs in 2026
A modeled 25-year comparison of solar-only and solar-plus-battery options, using estimated U.S. residential costs and electricity values.
Estimated Long-Term Value of Residential Solar and Battery Options (USD)
| System option |
Solar and storage size |
Estimated installed cost |
Estimated first-year bill savings |
Simple payback period |
Estimated 25-year bill savings |
Estimated battery replacement cost |
Estimated 25-year net value |
| Solar only |
8 kW solar; no battery |
$24,000 |
$1,030 / year |
23.3 years |
$24,300 |
— |
+$300 |
| Solar + 10 kWh battery |
8 kW solar; 10 kWh battery |
$36,000 |
$1,520 / year |
23.7 years |
$35,800 |
$8,000 |
−$8,200 |
| Solar + 20 kWh battery |
8 kW solar; 20 kWh battery |
$45,000 |
$1,730 / year |
26.0 years |
$40,700 |
$14,000 |
−$18,300 |
How to read these estimates: Figures are illustrative, not a quote. The model assumes an 8 kW system producing about 10,800 kWh in its first year, an average electricity price of $0.18/kWh, and $0.05/kWh compensation for exported solar power. It estimates that the home uses 35% of solar generation directly with no battery, 70% with a 10 kWh battery, and 85% with a 20 kWh battery. Installed costs are modeled at $24,000 for solar, plus $12,000 for 10 kWh of storage or $21,000 for 20 kWh. The 25-year estimate allows for 0.5% annual solar output degradation and subtracts one modeled battery replacement during the period. Net value equals estimated 25-year bill savings minus initial cost and battery replacement cost. Taxes, incentives, financing, maintenance, utility fixed charges, outages, and local rate or export-credit differences are excluded. Actual results depend heavily on location, roof conditions, household usage, and utility rules.